Projection Clusters
The hierarchy of the h-NNE is inspired by the FINCH clustering (https://github.com/ssarfraz/FINCH-Clustering). This means that during the generation of the hierarchy a collection of partitions of the dataset is generated. This set of partitions can be useful when one is dealing with unlabeled data. Using different levels of the hierarchy, one can identify clusters which align with the h-NNE projection structure. We already presented the functionality in the demo 1 notebook. Here we look at a more realistic scenario with a larger dataset containing no labels. The dataset we use is a list of 3 million word embeddings of dimension 300 based on the Google news dataset.
WARNING: To run this code be sure to use a server with at least 64GB of RAM.
NOTE: Here we are using h-NNE v1, as v2 visually separates the FINCH clusters of some of the top levels.
To install the required libraries with pip run:
pip install gensim
pip install matplotlib
pip install hnne
Next, we will need the dataset. It can be downloaded from this website: https://code.google.com/archive/p/word2vec. The file needed is ‘GoogleNews-vectors-negative300.bin.gz’, there is a link to it under the section ‘Pre-trained word and phrase vectors’. Once the data is downloaded, one only needs to provide the correct path to ‘GoogleNews-vectors-negative300.bin.gz’ to the ‘load_google_news’ function.
Once you have the data, we can get started. First import the libraries:
from gensim import models
import numpy as np
import matplotlib.pyplot as plt

from hnne import HNNE
Right after, load the data:
def load_google_news(data_path):
    return models.KeyedVectors.load_word2vec_format(
        data_path,
        binary=True
    ).vectors

data_path = './GoogleNews-vectors-negative300.bin.gz'
data = load_google_news(data_path)
Project the data with h-NNE:
hnne = HNNE(hnne_version="v1")
projection = hnne.fit_transform(data, verbose=True)
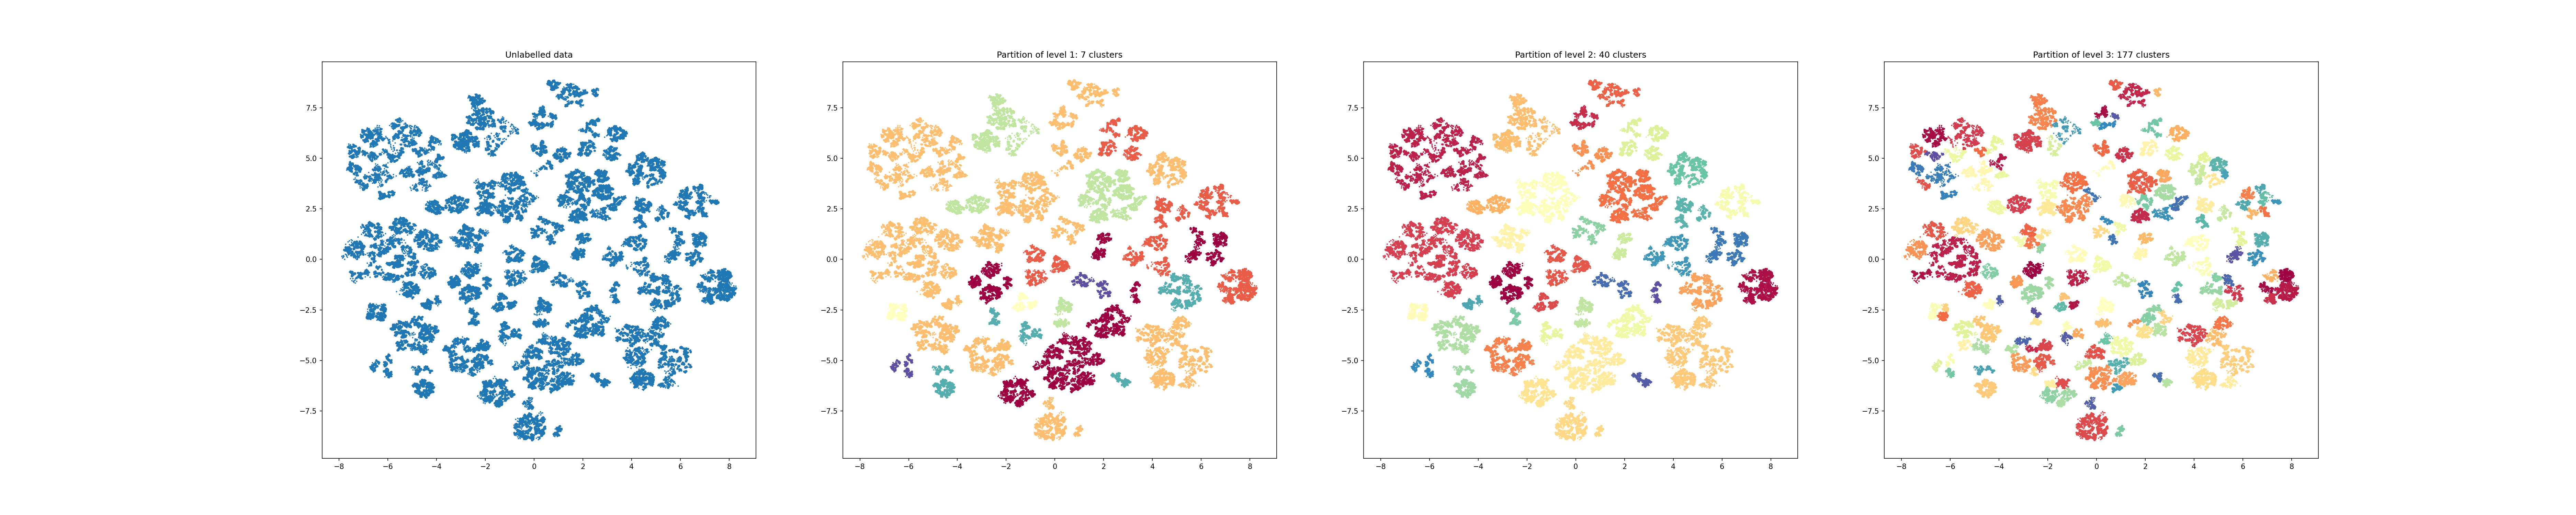
Along with the projected point, the partitions of all levels of h-NNE are available via the .hierarchy_parameters.partitions attribute. Below we display the projected data labeled based on some of the top level partitions:
partitions = hnne.hierarchy_parameters.partitions
partition_sizes = hnne.hierarchy_parameters.partition_sizes
number_of_levels = partitions.shape[1]

_, ax = plt.subplots(1, 4, figsize=(10*(4 + 1), 10))

ax[0].set_title('Unlabelled data')
ax[0].scatter(*projection.T, s=1)

for i in range(1, 4):
    partition_idx = number_of_levels - i
    ax[i].set_title(f'Partition of level {i}: {partition_sizes[partition_idx]} clusters')
    ax[i].scatter(*projection.T, s=1, c=partitions[:, partition_idx], cmap='Spectral')
plt.show()
This clustering can be used to improve visualization or even preprocess the data. No matter which dimension you project to, the same partitions will be used by h-NNE.
An extended version of this example can be found at this notebook.